


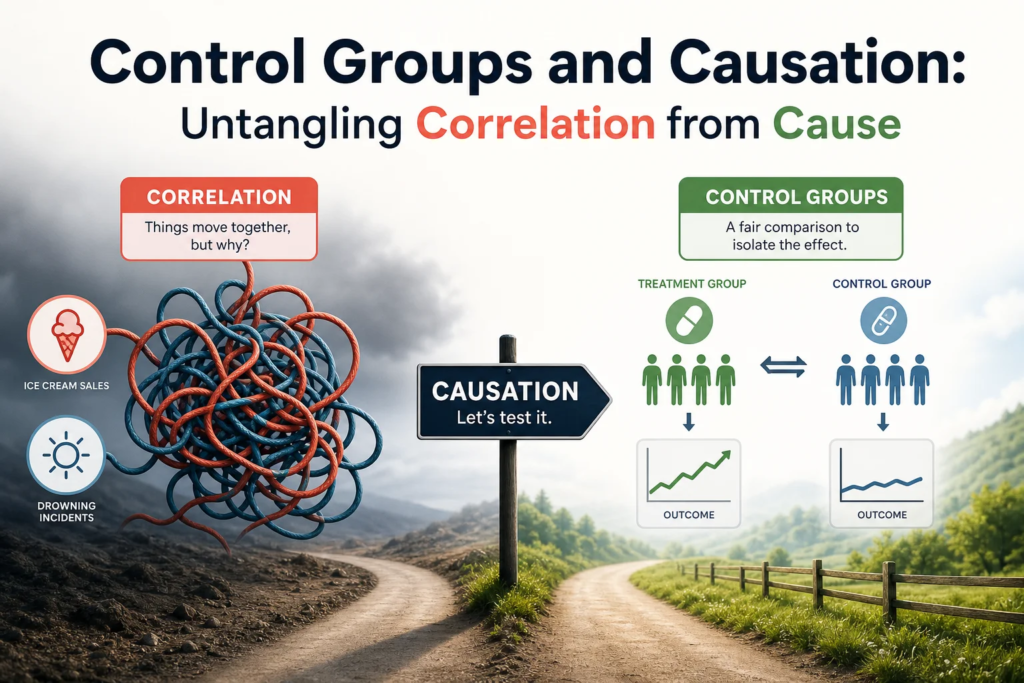
A strange thing happens when people look at data: patterns appear everywhere.
Ice cream sales rise when drowning incidents rise. People who carry lighters are more likely to develop lung cancer. Cities with more firefighters often have more fire damage. Children with bigger shoe sizes tend to read better than children with smaller shoe sizes.
At first glance, these relationships seem meaningful. But are they causal?
That is the question at the heart of Control Groups and Causation: Untangling Correlation from Cause. In science, business, medicine, education, public policy, and everyday decision-making, the difference between correlation and causation can determine whether we save lives, waste millions, or confidently make the wrong decision.
Correlation tells us two things move together. Causation tells us one thing actually produces a change in another. The gap between those ideas is where control groups become essential.
This article explores Control Groups and Causation: Untangling Correlation from Cause in depth: what control groups are, why they matter, how they work, where they fail, and how real-world organizations use them to make smarter decisions.
If you have ever wondered whether a new medicine works, whether a marketing campaign truly increased sales, or whether a policy actually improved outcomes, you are already asking the central question behind Control Groups and Causation: Untangling Correlation from Cause.
Why Correlation Is Tempting—and Often Misleading
Correlation is easy to find because the world is full of overlapping patterns. When two variables move together, our brains naturally want to build a story.
For example:
- People who exercise more tend to have better health.
- Students who attend elite schools often earn higher salaries.
- Companies that post frequently on social media may have higher brand awareness.
- Neighborhoods with more police may report more crime.
Each statement may be statistically true. But none automatically proves causation.
Maybe exercise improves health. But maybe healthier people are more able to exercise. Maybe elite schools increase earnings. But maybe students who get into elite schools already had advantages. Maybe more police cause more crime reports because police are deployed where crime is already higher.
This is why Control Groups and Causation: Untangling Correlation from Cause is more than a research concept. It is a practical skill for thinking clearly.
Correlation vs. Causation at a Glance
| Concept | What It Means | Example | Key Question |
|---|---|---|---|
| Correlation | Two variables move together | Ice cream sales and drowning deaths both rise in summer | Are they connected by a hidden factor? |
| Causation | One variable directly affects another | Taking an antibiotic cures a bacterial infection | Did the treatment produce the outcome? |
| Confounding | A third variable influences both | Hot weather increases both ice cream sales and swimming | What else could explain the pattern? |
| Control Group | A comparison group not receiving the treatment | Patients receiving placebo instead of medicine | What would have happened without the treatment? |
The control group is what transforms guesswork into evidence. It allows researchers to compare what happened with an intervention against what likely would have happened without it.
That comparison is the core of Control Groups and Causation: Untangling Correlation from Cause.
The Big Idea: Causation Requires a Counterfactual
To understand causation, imagine asking this question:
What would have happened to the same person, company, school, or community if the intervention had not occurred?
That imaginary alternative outcome is called the counterfactual.
If a patient takes a drug and recovers, we cannot immediately know whether the drug caused the recovery. Maybe the patient would have recovered anyway. If a company launches an ad campaign and sales rise, perhaps demand was already increasing. If a school introduces a new reading program and test scores improve, maybe students were improving due to other factors.
A control group helps approximate the counterfactual.
In Control Groups and Causation: Untangling Correlation from Cause, the key insight is simple but powerful: we cannot observe both realities for the same subject at the same time. A person cannot both take and not take the same medication under identical conditions. A customer cannot both see and not see the same advertisement in the same moment.
So we create groups.
One group receives the intervention. Another comparable group does not. If the groups are truly similar except for the treatment, differences in outcomes are more likely to be caused by the intervention.
That is the foundation of experimental evidence.
What Is a Control Group?
A control group is a group used as a baseline for comparison. It does not receive the treatment, intervention, or change being tested—or it receives a standard treatment, placebo, or alternative condition.
The purpose is not to “do nothing.” The purpose is to measure what happens without the specific intervention.
In medical research, a control group may receive a placebo. In marketing, a control group may not see a new advertisement. In education, a control group may continue with the existing curriculum while another group tests a new teaching method. In product design, a control group may see the old webpage while another group sees a new version.
This is why Control Groups and Causation: Untangling Correlation from Cause matters across fields. Whenever people ask, “Did this actually work?” they need a comparison.
Common Types of Control Groups
| Type of Control Group | Description | Common Use |
|---|---|---|
| Placebo control | Receives an inactive substitute | Drug trials, clinical research |
| No-treatment control | Receives no intervention | Behavioral studies, policy tests |
| Standard-care control | Receives existing treatment | Medical and educational studies |
| Waitlist control | Receives treatment later | Therapy, training programs |
| Historical control | Compared with past data | Public health, operations research |
| Active control | Receives a different intervention | Comparing two drugs or strategies |
| A/B control | Sees current version while test group sees variation | Marketing, websites, apps |
Each type has strengths and weaknesses. The best choice depends on ethics, feasibility, cost, and the nature of the question.
Why Randomization Is So Powerful
Control groups are useful, but they become far stronger when paired with randomization.
Randomization means assigning participants to treatment and control groups by chance rather than by preference, convenience, or judgment. This helps ensure the groups are similar before the intervention begins.
Without randomization, hidden differences can distort results. Suppose a fitness app lets users choose whether to join a premium coaching program. Those who choose coaching may already be more motivated. If they lose more weight, is it because of the program or their motivation?
Random assignment reduces this problem.
In Control Groups and Causation: Untangling Correlation from Cause, randomization is often the gold standard because it balances both visible and invisible factors across groups.
Randomized Controlled Trial: Basic Structure
| Step | What Happens | Why It Matters |
|---|---|---|
| 1. Define population | Decide who is eligible | Ensures relevance |
| 2. Randomly assign groups | Participants are assigned by chance | Reduces selection bias |
| 3. Apply intervention | Treatment group receives change | Creates test condition |
| 4. Maintain control condition | Control group does not receive change | Establishes comparison |
| 5. Measure outcomes | Same metrics for both groups | Enables fair comparison |
| 6. Analyze difference | Compare treatment vs. control | Estimates causal effect |
A randomized controlled trial, or RCT, is powerful because it answers a disciplined question: Compared with what?
That phrase—compared with what?—is the heartbeat of Control Groups and Causation: Untangling Correlation from Cause.
Case Study 1: James Lind and the Scurvy Experiment
One of the earliest famous examples of control-group thinking came from James Lind, an 18th-century Scottish naval surgeon.
Scurvy was devastating sailors on long voyages. Symptoms included bleeding gums, weakness, wounds that would not heal, and death. Many theories existed, but little clear evidence.
In 1747, Lind selected 12 sailors with scurvy and divided them into small groups. Each group received a different treatment: cider, vinegar, seawater, citrus fruit, and other remedies. The sailors who received oranges and lemons improved dramatically.
Although Lind’s experiment was small and imperfect by modern standards, it showed the importance of comparison. Citrus fruit stood out because other sailors with the same condition did not improve in the same way.
Analysis: Why This Matters
This case is a classic moment in Control Groups and Causation: Untangling Correlation from Cause because Lind did not merely observe that some sailors recovered. He compared treatments under similar circumstances.
The lesson is timeless: without comparison, recovery could be attributed to luck, time, weather, diet, or superstition. With comparison, citrus became a plausible cause.
Case Study 2: The Polio Vaccine Trial
In the 1950s, polio terrified families. The disease could paralyze or kill children, and the search for a vaccine was urgent.
The 1954 Salk polio vaccine trial became one of the largest and most important medical experiments in history. More than a million children participated. In randomized portions of the trial, some received the vaccine while others received a placebo. Researchers then compared infection rates.
The vaccine proved effective, and the results helped launch mass immunization efforts.
Analysis: Why This Matters
The polio trial represents Control Groups and Causation: Untangling Correlation from Cause at massive scale. Without a control group, researchers might have misread natural changes in polio rates as vaccine effects. Disease outbreaks fluctuate over time. A decline after vaccination does not automatically prove the vaccine caused the decline.
The control group helped answer the real question: did vaccinated children experience less polio than comparable unvaccinated children?
That distinction saved lives.
Case Study 3: Hormone Replacement Therapy and the Danger of Observational Data
For years, observational studies suggested that hormone replacement therapy, or HRT, reduced heart disease risk in postmenopausal women. Women taking HRT appeared healthier than those who did not.
The correlation seemed convincing.
But randomized trials later challenged the assumption. The Women’s Health Initiative found that certain forms of HRT did not provide the expected heart-protective benefits and carried serious risks for some women.
What happened?
Women who chose HRT were often different from those who did not. They may have had better access to healthcare, healthier lifestyles, higher income, or more preventive care. These factors could explain the better outcomes seen in earlier observational studies.
Analysis: Why This Matters
This is one of the most important examples of Control Groups and Causation: Untangling Correlation from Cause in modern medicine. It shows how even large, sophisticated observational studies can be misleading when treatment groups differ from comparison groups.
The lesson is not that observational data is useless. It is that correlation must be handled carefully, especially when hidden confounders influence who receives treatment.
Case Study 4: A/B Testing in Digital Marketing
Imagine an e-commerce company redesigns its checkout page. After launch, revenue increases by 12%. The team celebrates.
But did the new page cause the increase?
Maybe the company launched during a holiday shopping season. Maybe a competitor ran out of stock. Maybe an influencer mentioned the brand. Maybe returning customers were already planning purchases.
A better approach is an A/B test.
Half of visitors see the old checkout page. Half see the new version. If the new version produces higher conversions under the same time period and traffic conditions, the company has stronger evidence that the redesign caused the improvement.
Example A/B Test Results
| Group | Version Seen | Visitors | Conversion Rate | Revenue per Visitor |
|---|---|---|---|---|
| Control | Old checkout page | 50,000 | 3.8% | $2.90 |
| Treatment | New checkout page | 50,000 | 4.4% | $3.35 |
| Difference | Treatment effect | — | +0.6 percentage points | +$0.45 |
Analysis: Why This Matters
This business example shows Control Groups and Causation: Untangling Correlation from Cause in everyday commercial decision-making. A control group protects teams from confusing timing with impact.
Good A/B testing is not just about website tweaks. It is a disciplined method for learning what truly changes behavior.
Case Study 5: Education Programs and Selection Bias
Suppose a school district launches an optional after-school tutoring program. Students who attend improve their math scores more than students who do not.
Did tutoring cause the improvement?
Possibly. But students who voluntarily attend tutoring may have more motivated parents, better attendance, stronger study habits, or greater concern about grades.
A randomized design would provide stronger evidence. Eligible students could be randomly assigned to receive tutoring immediately or placed on a waitlist. Comparing outcomes between the two groups would better isolate the effect of tutoring.
Analysis: Why This Matters
This example highlights a recurring challenge in Control Groups and Causation: Untangling Correlation from Cause: people who choose an intervention often differ from people who do not.
Selection bias can make weak programs look strong—or strong programs look weak. Control groups help separate program impact from participant characteristics.
The Main Threats to Causal Thinking
Even with control groups, causal claims require care. Research design can fail in subtle ways.
1. Selection Bias
Selection bias occurs when treatment and control groups differ before the intervention begins. If more motivated people enter the treatment group, outcomes may reflect motivation rather than treatment.
2. Confounding Variables
A confounder is a hidden factor that affects both the supposed cause and the outcome. Temperature confounds the relationship between ice cream sales and drowning. Age confounds the relationship between shoe size and reading ability.
3. Reverse Causality
Sometimes the direction of cause is backward. Does stress cause poor sleep, or does poor sleep cause stress? Often both may be true.
4. Regression to the Mean
Extreme outcomes tend to move closer to average over time. If a company intervenes after a terrible sales month, sales may improve naturally even if the intervention did nothing.
5. Hawthorne Effect
People may change behavior simply because they know they are being observed.
6. Attrition Bias
If participants drop out of a study unevenly across groups, results can become distorted. For example, if people who experience side effects leave a treatment trial, the final results may look overly positive.
7. Spillover Effects
Members of the control group may be influenced by the treatment group. In schools, students receiving a new study technique may share it with classmates in the control group.
Understanding these threats is essential to Control Groups and Causation: Untangling Correlation from Cause because a control group is not magic. It must be designed, protected, and interpreted well.
When Randomized Control Groups Are Not Possible
Randomized experiments are powerful, but they are not always ethical or practical.
We cannot randomly assign people to smoke cigarettes for decades to study cancer. We cannot randomly deny emergency care to patients. We cannot randomly expose communities to pollution. In many policy settings, random assignment is politically or logistically impossible.
So researchers use alternative methods to approximate causal evidence.
Alternatives to Randomized Control Groups
| Method | How It Works | Example |
|---|---|---|
| Natural experiment | Uses real-world events that create quasi-random variation | Comparing regions affected by a policy change |
| Difference-in-differences | Compares changes over time between affected and unaffected groups | Minimum wage changes across states |
| Regression discontinuity | Compares people just above and below a cutoff | Scholarship eligibility based on test score threshold |
| Matching | Pairs treated and untreated subjects with similar characteristics | Comparing patients with similar health profiles |
| Instrumental variables | Uses an external factor that affects treatment but not outcome directly | Distance to hospital as a proxy for treatment access |
| Interrupted time series | Examines trends before and after an intervention | Traffic accidents before and after a seatbelt law |
These methods are part of the broader toolkit of Control Groups and Causation: Untangling Correlation from Cause. They are not perfect substitutes for randomized trials, but when used carefully, they can reveal causal patterns in complex real-world settings.
The Ethics of Control Groups
Control groups raise ethical questions, especially when health, safety, or opportunity is involved.
Is it ethical to withhold a potentially beneficial treatment? Is it fair to give one school a new resource and not another? Should patients receive a placebo if an effective standard treatment already exists?
Ethical research requires safeguards.
Ethical Principles for Control Groups
| Principle | Meaning |
|---|---|
| Informed consent | Participants understand the study and risks |
| Equipoise | There is genuine uncertainty about which option is better |
| Minimized harm | Researchers avoid unnecessary risk |
| Right to withdraw | Participants can leave without penalty |
| Fair selection | Groups are chosen without exploitation |
| Independent review | Ethics boards evaluate study design |
In medicine, placebo controls are often inappropriate when an effective treatment already exists. In education or social programs, waitlist controls may be more ethical because the control group receives the intervention later.
A mature understanding of Control Groups and Causation: Untangling Correlation from Cause includes not only statistical rigor but moral responsibility.
How Control Groups Help Businesses Avoid Costly Mistakes
Businesses often move fast, but speed without evidence can be expensive.
A company may believe a rebrand increased customer loyalty because retention improved afterward. A sales leader may think a new script boosted conversions because monthly sales rose. A product team may assume push notifications increased engagement because active users climbed after launch.
But business environments are noisy. Seasonality, pricing, competitors, economic shifts, and customer mix can all influence outcomes.
Control groups help answer questions like:
- Did the email campaign increase purchases?
- Did free shipping improve profit or simply attract low-margin orders?
- Did the new onboarding flow improve retention?
- Did the loyalty program increase customer lifetime value?
- Did discounts generate incremental sales or reward people who would have bought anyway?
This is Control Groups and Causation: Untangling Correlation from Cause applied to growth strategy. The companies that learn fastest are often those that compare best.
A Practical Framework for Designing a Strong Control Group
Whether you are running a clinical trial, policy evaluation, classroom study, or marketing experiment, a solid design begins with disciplined questions.
Step 1: Define the Causal Question
Avoid vague goals like “Does this work?”
Ask:
What is the effect of X on Y for Z population over T time period?
Example:
What is the effect of weekly tutoring on 8th-grade math test scores over one semester?
Step 2: Identify the Treatment
Be precise. What exactly changes? Is it a drug dosage, new curriculum, landing page, pricing model, or coaching program?
Step 3: Choose the Control Condition
Will the control group receive no treatment, usual treatment, placebo, or delayed treatment?
Step 4: Randomize When Possible
Randomization reduces bias. If randomization is impossible, document why and use the strongest feasible quasi-experimental design.
Step 5: Measure Baseline Characteristics
Collect pre-treatment data. This helps confirm whether groups are comparable.
Step 6: Use Clear Outcome Metrics
Pick primary outcomes before analyzing results. Avoid changing metrics after seeing the data.
Step 7: Protect Against Contamination
Ensure the control group is not accidentally exposed to the treatment.
Step 8: Analyze Both Statistical and Practical Significance
A result may be statistically significant but too small to matter. Or practically meaningful but underpowered due to small sample size.
Step 9: Replicate When Possible
One experiment is evidence. Repeated evidence is confidence.
This framework is the operational side of Control Groups and Causation: Untangling Correlation from Cause. It turns a good idea into a credible test.
Common Misinterpretations of Control Group Results
Even strong experiments can be misunderstood.
“The Treatment Worked for Everyone”
An average treatment effect does not mean every participant benefited. Some people may improve, some may not change, and others may be harmed.
“No Significant Effect Means No Effect”
A study may fail to detect an effect because the sample size is too small, measurement is poor, or the effect varies across subgroups.
“A Bigger Difference Always Means a Better Intervention”
A large short-term effect may fade quickly. A smaller but durable effect may be more valuable.
“The Result Applies Everywhere”
External validity matters. A study conducted in one hospital, school, country, or customer segment may not generalize.
“The Control Group Was Unchanged”
Control groups are affected by context too. Market conditions, public events, seasonal shifts, and social influence may affect all groups.
These cautions are central to Control Groups and Causation: Untangling Correlation from Cause because causal evidence still requires judgment.
The Role of Blinding and Placebos
In many studies, people’s expectations influence outcomes. If patients know they are receiving a treatment, they may report improvement because they expect to improve. If researchers know who received the treatment, they may unconsciously interpret results differently.
Blinding reduces this risk.
- Single-blind study: Participants do not know which group they are in.
- Double-blind study: Neither participants nor researchers interacting with them know.
- Triple-blind study: Analysts may also be blinded until analysis is complete.
Placebos are especially useful when outcomes are subjective, such as pain, mood, or fatigue. However, placebo use must be ethical.
In Control Groups and Causation: Untangling Correlation from Cause, blinding strengthens the comparison by reducing expectation-driven distortions.
Data Visualization: How a Control Group Changes the Story
Consider a company that introduces a customer retention campaign in July.
Without a Control Group
| Month | Retention Rate |
|---|---|
| April | 72% |
| May | 73% |
| June | 74% |
| July | 77% |
| August | 79% |
It looks like the campaign worked.
But now add a control group.
With a Control Group
| Month | Treatment Group | Control Group |
|---|---|---|
| April | 72% | 72% |
| May | 73% | 73% |
| June | 74% | 74% |
| July | 77% | 77% |
| August | 79% | 79% |
Now the story changes. Retention improved for everyone, including customers who did not receive the campaign. The increase may be due to seasonality, product improvements, or broader market conditions.
This table captures Control Groups and Causation: Untangling Correlation from Cause in one glance: without comparison, we mistake movement for impact.
How to Spot Weak Causal Claims in the Wild
You do not need a PhD to become better at evaluating causal claims. When you see a headline, report, or business case, ask:
- Compared with what?
- Was there a control group?
- Were participants randomly assigned?
- Could another factor explain the result?
- Did the cause happen before the effect?
- How large was the effect?
- Was the sample representative?
- Were outcomes measured objectively?
- Did people drop out?
- Has the result been replicated?
These questions reflect the everyday value of Control Groups and Causation: Untangling Correlation from Cause. They help you resist overconfidence and demand better evidence.
Long-Tail Keyword Variations and Contextual Phrases
Readers often search for this topic using different phrases. Useful variations include:
- how control groups prove causation
- control groups vs correlation
- difference between correlation and causation examples
- randomized controlled trial and causal inference
- why control groups matter in experiments
- how to untangle correlation from cause
- causal inference with control groups
- examples of control groups in research
- correlation does not imply causation explained
- treatment group vs control group
These variations all point back to the same central theme: Control Groups and Causation: Untangling Correlation from Cause.
Why This Topic Matters More in the Age of Big Data
Big data has made correlation easier to find than ever. Companies can track clicks, purchases, locations, heart rates, searches, and social behavior. Governments can analyze massive administrative datasets. Researchers can mine millions of records.
But more data does not automatically mean better causation.
In fact, big data can make false confidence worse. With enough variables, some patterns will appear by chance. A dashboard may show that users who engage with a feature are more likely to renew, but perhaps loyal users are simply more likely to explore features.
The modern challenge is not just collecting data. It is interpreting data responsibly.
That is why Control Groups and Causation: Untangling Correlation from Cause is increasingly important. The future belongs not to organizations with the most data, but to those that ask the best causal questions.
The Human Side: Why We Struggle with Causation
People are natural storytellers. We want reasons. We like clean narratives: this happened, then that happened, so this caused that.
But reality is messy.
Multiple causes can operate at once. Effects can be delayed. Feedback loops can exist. People change behavior when observed. Systems adapt. What works in one place may fail elsewhere.
Our minds prefer simplicity, but evidence demands discipline.
Control Groups and Causation: Untangling Correlation from Cause helps slow down the rush to judgment. It asks us to replace “That must be why” with “How would we know?”
That shift is powerful.
Conclusion: Better Evidence, Better Decisions
The difference between correlation and causation is not academic trivia. It affects medical treatments, business investments, education reforms, public policies, product decisions, and personal choices.
Control groups give us a way to compare reality with a credible alternative. They help reveal whether an intervention truly caused an outcome or merely appeared alongside it.
The core lessons of Control Groups and Causation: Untangling Correlation from Cause are clear:
- Correlation is a clue, not proof.
- Causation requires comparison.
- Control groups approximate the counterfactual.
- Randomization reduces bias.
- Confounders can mislead even smart people.
- Ethical design matters.
- Good causal thinking improves real-world decisions.
The next time you see a bold claim—“This diet works,” “This policy reduced crime,” “This campaign drove sales,” “This app improves learning”—pause and ask the most important question:
Compared with what?
That simple question is the doorway to clearer thinking. It is the practical wisdom behind Control Groups and Causation: Untangling Correlation from Cause, and it can protect you from expensive mistakes, misleading narratives, and false certainty.
1. What is the main difference between correlation and causation?
Correlation means two variables are related or move together. Causation means one variable directly produces a change in another. For example, umbrella use and rain are correlated, but umbrellas do not cause rain. Control Groups and Causation: Untangling Correlation from Cause focuses on separating simple association from true cause-and-effect relationships.
2. Why are control groups important?
Control groups provide a baseline for comparison. They help show what would have happened without the treatment or intervention. Without a control group, it is easy to mistake natural trends, outside events, or participant differences for causal effects.
3. Does a control group always prove causation?
Not always. A well-designed control group strengthens causal evidence, especially when combined with randomization. But poor design, small samples, attrition, spillover effects, or biased measurement can still weaken conclusions. Control Groups and Causation: Untangling Correlation from Cause requires careful design and interpretation.
4. What is the difference between a control group and a treatment group?
The treatment group receives the intervention being tested. The control group does not receive it, receives a placebo, or receives standard care. Researchers compare outcomes between the two groups to estimate the effect of the intervention.
5. Can you establish causation without a randomized control group?
Yes, sometimes. Methods such as natural experiments, regression discontinuity, difference-in-differences, matching, and instrumental variables can support causal inference. However, these methods require strong assumptions and careful analysis.
6. What is an example of confusing correlation with causation?
A classic example is ice cream sales and drowning incidents. They rise together, but ice cream does not cause drowning. Hot weather increases both ice cream purchases and swimming, which increases drowning risk. This is a confounding variable.
7. How do businesses use control groups?
Businesses use control groups in A/B testing, marketing campaigns, pricing experiments, product launches, and customer retention programs. For example, some customers may receive a promotional email while others do not. Comparing purchase behavior helps determine whether the email caused additional sales.
8. What makes a control group ethical?
An ethical control group is designed with informed consent, minimized harm, fair participant selection, and genuine uncertainty about the best option. In some cases, waitlist controls or standard-care controls are more ethical than placebo or no-treatment controls.
9. Why is randomization so important?
Randomization helps ensure that treatment and control groups are similar before the intervention begins. This reduces selection bias and makes it more likely that differences in outcomes are caused by the intervention rather than pre-existing differences.
10. What is the biggest takeaway from Control Groups and Causation: Untangling Correlation from Cause?
The biggest takeaway is this: never trust a causal claim without asking what it was compared against. Control groups help turn observations into evidence, and evidence leads to better decisions.


The PsyForU Editorial Collective is the research and editorial team of PsyForU Research International. The collective prepares educational, psychological, mental-health-awareness, inclusion, neurodiversity, and research-methodology content for students, parents, educators, researchers, and general readers. PsyForU content is intended for awareness, education, and capacity-building and should not be treated as clinical diagnosis, therapy, medical advice, legal advice, or emergency mental-health support.