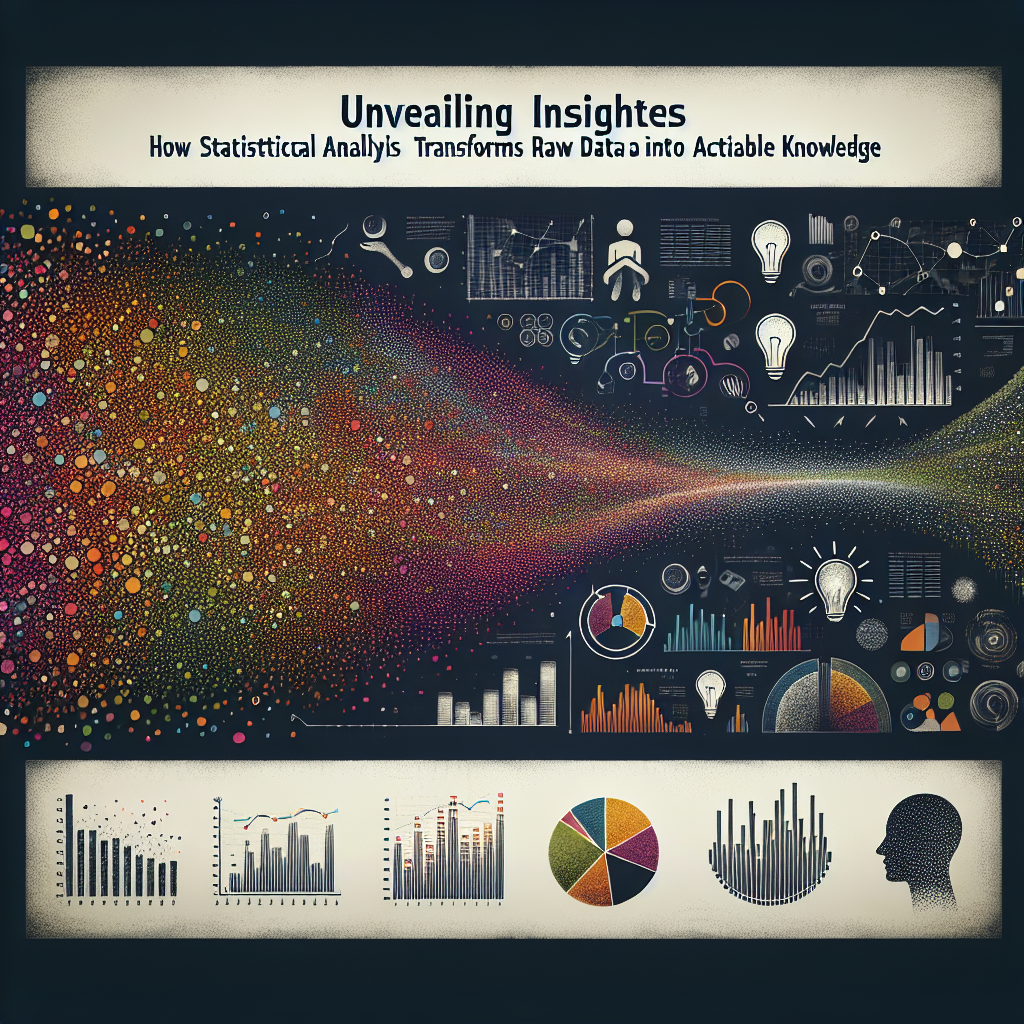
In today’s data-driven world, raw data inundates organizations at an unprecedented pace. The sheer volume of information collected can overwhelm decision-makers. Yet, within this chaos lies a golden opportunity: the chance to transform raw data into actionable knowledge through effective statistical analysis. This article delves into Unveiling Insights: How Statistical Analysis Transforms Raw Data into Actionable Knowledge, illuminating how the meticulous process of statistical analysis can unlock meaningful patterns, inform strategic decisions, and ultimately propel organizations toward success.
Introduction: The Goldmine of Raw Data
Every action and behavior in the digital age generates data. From customer interactions to employee performance metrics, the ability to harness this raw material is vital. However, without statistical analysis, this data remains merely noise. One might ask: How can organizations turn this noise into a symphony of insights that drive business outcomes? The answer lies in statistical methods. By employing statistical techniques, organizations can interpret vast datasets, reveal hidden trends, and derive insights that lead to informed decision-making.
The Importance of Statistical Analysis
Statistical analysis serves as a crucial tool for modern organizations. It aids in validating hypotheses, understanding correlations, and predicting future trends. In essence, Unveiling Insights: How Statistical Analysis Transforms Raw Data into Actionable Knowledge embodies the journey from numbers to narratives that resonate with stakeholders and influence outcomes.
Understanding Statistical Analysis
What is Statistical Analysis?
Statistical analysis refers to the systematic application of statistical techniques to analyze and interpret data. It encompasses various methods, including descriptive statistics, inferential statistics, and predictive analytics. Each method plays a significant role in unpacking the raw data, allowing organizations to make sense of what may initially appear as a chaotic influx of numbers.
Key Components of Statistical Analysis
Descriptive Statistics: This method summarizes raw data through measures such as mean, median, mode, and standard deviation. It provides a snapshot of the dataset, highlighting central tendencies and variability.
Inferential Statistics: By utilizing sample data to make inferences about a larger population, inferential statistics tests hypotheses and can predict future outcomes. Techniques such as t-tests and regression analysis fall under this category.
Predictive Analytics: With the help of advanced mathematical models, predictive analytics anticipates future events based on historical data. It’s essential in crafting data-driven strategies.
- Data Visualization: Presenting data through visual means—charts, graphs, and dashboards—enhances comprehension, making insights more accessible and interpretable.
The Transformation Process: From Raw Data to Actionable Insights
Step 1: Data Collection
The first step in Unveiling Insights: How Statistical Analysis Transforms Raw Data into Actionable Knowledge begins with the collection of raw data. This step must be meticulously planned to ensure the data gathered is relevant, reliable, and representative. Techniques for data collection include surveys, experiments, and automated tracking through software tools.
Step 2: Data Cleaning
Once collected, raw data often contains errors, omissions, or inconsistencies—commonly referred to as "dirty data." Data cleaning involves identifying and rectifying these issues to ensure the accuracy of subsequent analyses. This process is crucial; as the adage goes, "Garbage in, garbage out."
Step 3: Data Analysis
After cleaning, the real magic begins. Using statistical methods, analysts can explore relationships within the data. For instance, if a retail store wants to understand customer purchasing behavior, correlation analysis can reveal how various factors—like marketing expenditure or seasonal promotions—impact sales.
Case Study: Retail Success with Predictive Analytics
A mid-sized retail company employed predictive analytics to optimize its inventory management. By analyzing sales trends over several years, they identified patterns in consumer purchasing that fluctuated seasonally. This statistical analysis allowed them to stock products according to expected demand, significantly reducing excess inventory costs. This successful case illustrates how effective statistical analysis can transform raw sales data into actionable knowledge that enhances operational efficiency.
Step 4: Data Interpretation and Visualization
After analysis, interpreting the data involves contextualizing the findings in light of the original objectives. Visual tools—like graphs and charts—play a vital role here, making complex data easier to understand and communicate.
Step 5: Implementation of Insights
Ultimately, the goal of statistical analysis is to inform decisions. Armed with insights drawn from raw data, organizations can implement strategies—whether launching a marketing campaign, adjusting pricing strategies, or improving customer engagement.
Examples of Real-world Applications
Case Study 1: Healthcare Improvement
In the healthcare sector, statistical analysis has transformed patient care. A hospital used statistical methods to analyze patient data over a year. Through this analysis, they identified key trends affecting patient readmission rates. By implementing strategies based on these findings—such as enhanced discharge planning and post-discharge follow-ups—they reduced readmissions by 20%. This case demonstrates how statistical analysis can lead to impactful changes in healthcare practices, improving outcomes for patients.
Case Study 2: Financial Forecasting
A leading financial services firm leverages statistical models to forecast market trends. By examining historical market data, they can predict fluctuations, guiding investment strategies. In one instance, this analysis helped the firm avoid significant losses during a market downturn, illustrating Unveiling Insights: How Statistical Analysis Transforms Raw Data into Actionable Knowledge in financial decision-making.
| Case Study | Challenge | Statistical Technique Used | Outcome |
|---|---|---|---|
| Retail Company | Excess inventory costs | Predictive analytics | 30% reduction in holding costs |
| Healthcare Facility | High readmission rates | Trend analysis | 20% reduction in readmissions |
| Financial Services Firm | Market volatility | Time series forecasting | Informed investment strategies |
Challenges in Statistical Analysis
While the potential of statistical analysis is vast, organizations may face several challenges during the process:
Data Quality: Ensuring the reliability and validity of data is paramount. Poor-quality data leads to misleading insights.
Skills Gap: Not all organizations have access to skilled statisticians or data scientists capable of interpreting complex analyses.
Resource Allocation: Investing in technology for data analysis can be a financial burden for small to medium-sized enterprises.
- Interpreting Results: Statistical outputs can be complex. Organizations may struggle to translate findings into actionable strategies.
Addressing Common Concerns
FAQ 1: How can small businesses benefit from statistical analysis?
Small businesses can leverage statistical analysis to understand customer behavior, optimize marketing efforts, and streamline operations. Even basic analysis can yield valuable insights that guide growth strategies.
FAQ 2: Is statistical analysis only useful for large organizations?
No, statistical analysis is beneficial for organizations of all sizes. Smaller entities can use it to make informed decisions on marketing, sales, and customer engagement without needing substantial resources.
FAQ 3: What tools can I use for statistical analysis?
Numerous tools are available for statistical analysis, including Excel, R, Python, SPSS, and Tableau. The choice depends on the complexity of the analysis and user familiarity with the tool.
FAQ 4: What is the difference between correlation and causation?
Correlation indicates a relationship between two variables, while causation implies that one variable directly affects the other. Understanding this distinction is crucial for accurate interpretation of data.
FAQ 5: How can visualization enhance statistical analysis?
Visualization transforms complex data into accessible insights. By turning numbers into graphs or charts, stakeholders can quickly grasp trends and patterns, facilitating data-driven decision-making.
Conclusion: Embracing the Power of Statistical Analysis
As we’ve explored, the transformation of raw data into actionable knowledge is an essential endeavor for any forward-thinking organization. Through diligent statistical analysis, organizations can unveil insights that guide strategic decisions, enhance operational efficiency, and improve overall performance.
In embracing Unveiling Insights: How Statistical Analysis Transforms Raw Data into Actionable Knowledge, organizations not only pave the way for informed decision-making but also cultivate a culture of continuous improvement, innovation, and adaptability.
Harnessing raw data’s potential through statistical analysis can lead to remarkable transformations. The journey from raw numbers to meaningful narratives is not just an analytical process; it’s an invitation to reimagine possibilities and drive impactful change in a data-centric world. Are you ready to embark on this transformative journey? Insights await.
This article serves as a comprehensive guide to understanding and implementing statistical analysis in various fields, providing readers with the tools and knowledge needed to begin harnessing the power of their data.

