Can businesses really make decisions without knowing their data-driven landscape? In today’s fast world, finding patterns and trends in complex data sets is key. A Statista report shows that using data analysis helps companies get more customers and make more money.
The role of quantitative data analysis is huge. It helps organizations make smart choices. By using different data analysis techniques and statistical analysis tools, businesses can understand their operations and market trends better.
Key Takeaways
- Quantitative data analysis is key for businesses to make smart decisions.
- Data-driven companies are more likely to get customers and make money.
- There are many data analysis techniques and tools for businesses.
- Using quantitative data analysis gives valuable insights into business and market trends.
- Businesses can make better decisions by using data analysis.
Understanding Quantitative Data Analysis
Quantitative data analysis is key for businesses and researchers. It helps uncover patterns and trends in numbers. This way, organizations can make smart choices.
Definition and Importance
Quantitative data analysis uses numbers and math to understand data. It’s vital in business, healthcare, and social sciences. It gives clear insights for better decisions and growth.
Quantitative research is important for several reasons:
- It offers clear insights from numbers.
- It helps find patterns and trends.
- It supports making informed decisions.
- It helps evaluate programs and policies.
Key Characteristics of Quantitative Data
Quantitative data is all about numbers. This lets us use math to analyze it. The main traits of quantitative data are:
- Numerical values: It’s all about numbers, making math possible.
- Objectivity: It tries to remove personal bias for accurate findings.
- Replicability: Results can be checked again because methods are clear and systematic.
Types of Quantitative Data
It’s important to know the different types of quantitative data for good analysis. Quantitative data is all about numbers. It can be sorted based on its features and what analysis it needs.
Discrete vs. Continuous Data
Quantitative data falls into two big groups: discrete and continuous. Discrete data is about whole numbers, like how many students are in a class. Continuous data can be any number, including fractions, like height or weight.
For example, measuring height is continuous because it can be very precise (like 175.5 cm). But counting books on a shelf is discrete.
Levels of Measurement
Quantitative data also has levels of measurement. These levels decide what kind of analysis you can do. There are four main levels: nominal, ordinal, interval, and ratio scales.
- Nominal Scale: This is the simplest. It groups data without numbers, like gender or nationality.
- Ordinal Scale: This data can be ranked but the differences aren’t always the same, like satisfaction ratings.
- Interval Scale: This data has equal intervals but no true zero point, like temperature.
- Ratio Scale: This data has a real zero point and lets you compare sizes, like weight or height.
Knowing these levels is key for picking the right statistical methods and data analysis software.
For example, when using data visualization techniques, the data type and level matter. Bar charts and pie charts work for nominal data. But for interval and ratio data, histograms and scatter plots are better.
In summary, knowing the types and levels of quantitative data is vital for quantitative data modeling and analysis. By figuring out if data is discrete or continuous and its level, you can use the best statistical methods to get useful insights.
The Quantitative Research Process
To do quantitative research, you need to follow a strict process. This includes setting research questions, picking how to collect data, and analyzing it with statistical tools. This method is key to making sure your findings are reliable and valid.
Formulating Research Questions
The first step is to make clear and focused research questions. These should be specific, measurable, achievable, relevant, and time-bound (SMART). Good research questions help guide the whole process, from collecting data to analyzing it.
For example, a question might ask how a new marketing strategy affects sales over a certain time. The clarity of your question will help decide how to collect data and analyze it.
Data Collection Methods
There are many ways to collect quantitative data, like surveys, experiments, and observational studies. Each method is good for different types of questions.
| Data Collection Method | Description | Example |
|---|---|---|
| Surveys | Questionnaires used to collect self-report data from participants. | An online survey to gather opinions on a new product. |
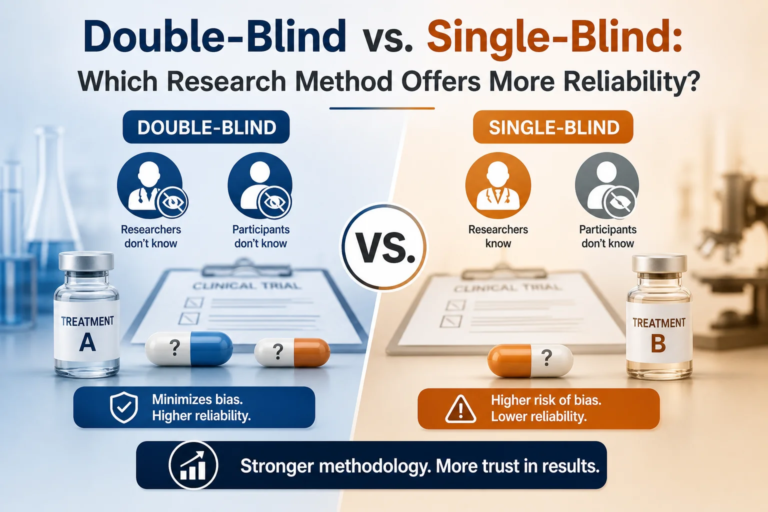
| Experiments | Controlled studies that manipulate variables to observe effects. | A clinical trial testing the efficacy of a new drug. |
| Observational Studies | Studies that observe subjects without intervening. | Observing consumer behavior in a retail environment. |
Analyzing Data
After collecting data, it needs to be analyzed with the right statistical methods. Statistical analysis tools are key for understanding the data and drawing conclusions. These tools help summarize the data and make inferences about larger groups.
The right statistical method depends on your question, the data type, and the study design. Techniques like regression analysis, hypothesis testing, and confidence intervals help find patterns and relationships in the data.
Statistical Techniques in Quantitative Data Analysis
Statistical techniques are key in analyzing data. They help us find important insights from big data sets. These methods are essential for understanding the data we collect.
Descriptive Statistics
Descriptive statistics summarize data basics. They give simple info about the sample and its measures. Common ones are mean, median, mode, and standard deviation.
For example, the mean shows the average of the data. The standard deviation shows how spread out the data is. These help us understand the data’s nature.
Inferential Statistics
Inferential statistics let us guess about a whole group based on a sample. We use tests to see if our findings are real and apply to everyone. Hypothesis testing and confidence intervals are key here.
Let’s say we use a t-test to see if two groups are different. Inferential stats are vital for making smart choices and predictions.
Regression Analysis
Regression analysis models how a dependent variable changes with independent variables. It’s great for forecasting and predicting. This method is used a lot.
There are many types, like simple and multiple regression. Simple uses one variable, while multiple uses more. It’s a strong tool for finding and predicting relationships.
Data Collection Tools and Techniques
In quantitative data analysis, picking the right data collection method is key. Data collection tools and techniques are the base of the analysis.

Surveys and Questionnaires
Surveys and questionnaires are top choices for collecting data. They ask participants about their views, actions, or experiences. Well-designed surveys give valuable data for analysis.
Surveys are good because they can reach many people and are affordable. But, they might have biases and getting enough answers can be hard.
Experiments and Observational Studies
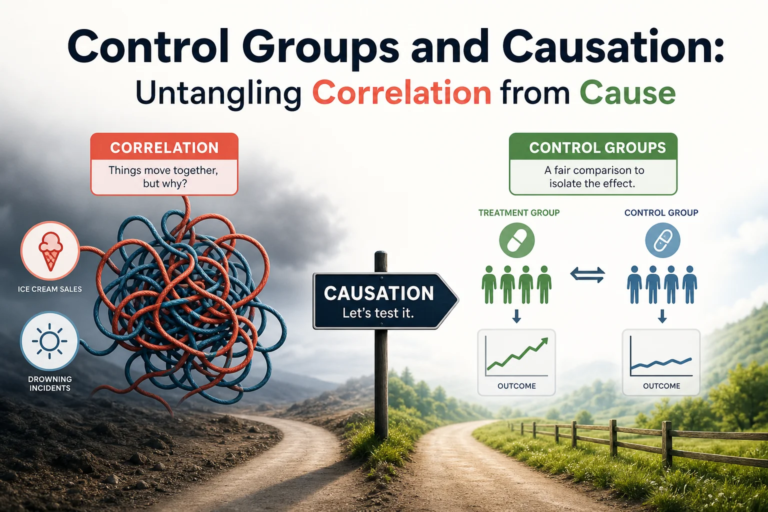
Experiments and observational studies are also key. Experiments change variables to see their effects. This shows cause and effect.
Observational studies watch participants without interfering. They’re great for real-life studies. Both methods need careful planning to avoid biases and ensure quality data.
Secondary Data Sources
Secondary data comes from others’ work. This includes government stats, past research, or company records. Secondary data saves time and money by not needing to collect it yourself.
But, it’s important to check the data’s quality and if it fits your research. Look at its accuracy, completeness, and relevance.
Knowing how to use these tools and techniques helps researchers get good data. This data supports strong analysis and useful insights.
Preparing Data for Analysis
Data preparation is key to reliable analysis. It makes sure the data is good to go for analysis. Getting data ready is essential for useful insights.
Data Cleaning
Data cleaning fixes errors in the data. It’s important because bad data can mess up analysis. Tasks include removing duplicates and fixing spelling mistakes.
Key data cleaning tasks include:
- Removing duplicate records to prevent bias in analysis.
- Correcting spelling and formatting errors to ensure consistency.
- Identifying and appropriately handling outliers that could skew results.
Data Transformation
Data transformation changes data format for analysis. It can include grouping data or making variables fit for tests. This makes analysis more reliable.
Common data transformation techniques include:
- Aggregating data to summarize it at a higher level.
- Normalizing data to ensure that different scales are comparable.
- Transforming variables to stabilize variance or make distributions more normal.
Handling Missing Data
Dealing with missing data is vital. It can happen for many reasons. How you handle it affects your analysis. Methods include imputation and listwise deletion.
Approaches to handling missing data:
- Imputation: Estimating missing values based on other data.
- Listwise deletion: Excluding records with missing values.
- Pairwise deletion: Excluding missing values on a case-by-case basis.
By carefully preparing data, researchers can trust their analysis. Using data analysis software helps make this process smoother and more accurate.
Visualizing Quantitative Data
Effective data visualization is key to sharing the results of quantitative data analysis. It helps both technical and non-technical people understand complex data. By showing data in a visual way, researchers can help others grasp the insights from the data.
Importance of Data Visualization
Data visualization is vital in quantitative data analysis. It makes complex data insights clear. Visuals like charts and graphs reveal trends, patterns, and correlations that might be hard to see in raw data. This clarity is key for making informed decisions based on data.
Also, data visualization helps in exploring data. It lets analysts find new insights and hypotheses. It’s also important for sharing findings with people who may not know much about statistics. This helps bridge the gap between data analysis and decision-making.
Common Visualization Tools
Many tools are used for data visualization in quantitative data analysis. These include:
- Bar Charts and Histograms: Useful for displaying the distribution of categorical data and the frequency of different categories.
- Line Graphs: Effective for showing trends over time or across different categories.
- Scatter Plots: Ideal for illustrating the relationship between two variables.
- Heat Maps: Useful for representing complex data relationships through color-coded matrices.
| Visualization Tool | Primary Use | Example |
|---|---|---|
| Bar Charts | Categorical data comparison | Comparing sales across different regions |
| Line Graphs | Trend analysis over time | Tracking stock prices over a year |
| Scatter Plots | Relationship between two variables | Analyzing the correlation between temperature and energy consumption |
Best Practices for Effective Visuals
To create effective data visualizations, follow these best practices:
- Simplicity: Avoid clutter and focus on the key message.
- Accuracy: Ensure that the visualization accurately represents the data.
- Consistency: Use consistent scales and color schemes across visualizations.
- Interactivity: Consider using interactive visualizations to allow users to explore the data in more detail.
By following these best practices and using common visualization tools, researchers can share insights from quantitative data analysis effectively. This helps in making better decisions in various fields.
Interpreting Quantitative Data Results
Quantitative data analysis goes beyond just numbers. It’s about understanding what those numbers mean. This step is key to getting insights that help make decisions.
Understanding Statistical Significance
Statistical significance shows if results are real or just by chance. Understanding statistical significance is vital. It tells us if our findings are trustworthy. Tools help us figure out this significance, often using a p-value.
The p-value shows the chance of getting the results we see if there’s no real effect. A p-value under 0.05 means there’s less than a 5% chance. This suggests our results might be real.
Drawing Conclusions
When we draw conclusions, we combine our statistical findings. We answer our research questions or test our hypotheses. It’s important to think about the study’s context, design, and data collection.
Effective conclusion drawing needs a deep grasp of the data and methods. We must be careful not to jump to conclusions. Our conclusions should match the data and our research goals.
Reporting Findings
Reporting our findings is a big deal. We need to share complex data in a way everyone can understand. The report should be easy to read and fit the audience.
Best practices for reporting include using visual aids like tables and graphs. The report should clearly show the main points and what they mean. It’s also key to talk about the study’s limits and future research ideas.
In summary, understanding quantitative data is complex. It involves looking at statistical significance, drawing conclusions, and reporting findings clearly. By using the right tools and following best practices, we can share insights that are useful and meaningful.
Applications of Quantitative Data Analysis
In today’s world, quantitative data analysis is key in many areas. It helps shape strategies in various sectors. Its uses are wide and help in making important decisions.
Business and Market Research
In business, quantitative data analysis is vital. It helps understand market trends, customer behavior, and marketing campaign success. Companies use it to find ways to improve and predict future trends.
For example, analyzing sales data shows how well a product or service is doing.
The main uses in business are:
- Market segmentation: It helps target specific customer groups by analyzing demographic data.
- Customer satisfaction analysis: Surveys and feedback are used to measure how happy customers are.
- Financial forecasting: It predicts future revenues and expenses based on past data.
Healthcare and Clinical Trials
In healthcare, quantitative data analysis is essential. It improves patient care, understands disease patterns, and checks treatment effectiveness. Clinical trials rely on it to see if new drugs and devices are safe and work well.
Some main uses in healthcare are:
- Epidemiological studies: It analyzes data to track disease spread.
- Clinical trial analysis: It checks if new treatments are effective.
- Healthcare management: It helps manage resources and improve patient care.
Education and Social Sciences
In education and social sciences, quantitative data analysis is important. It helps understand educational results, social behaviors, and policy effects. It analyzes big datasets to find trends and patterns that guide educational policies and social programs.
Key uses in this field are:
- Educational assessment: It analyzes test scores to see how students are doing.
- Policy evaluation: It checks how educational policies affect students.
- Social research: It studies social phenomena to find causes and effects.
Challenges in Quantitative Data Analysis
Quantitative data analysis comes with its own set of challenges. These include problems with data quality and the chance of misreading results. As we explore the complexities of quantitative data, we see that several obstacles can affect the accuracy and trustworthiness of the insights gained.
Data Quality Issues
Ensuring the quality of data is a major challenge in quantitative data analysis. Data quality issues can stem from many sources, such as:
- Inaccurate or incomplete data collection methods
- Presence of outliers or anomalous data points
- Inconsistent data formatting
- Missing data
To tackle these problems, it’s vital to use strong data cleaning and preprocessing methods. This might involve:
- Checking data against known benchmarks or standards
- Using statistical methods to manage missing data or outliers
- Standardizing data formats for consistency

Misinterpretation of Results
Another big challenge in quantitative data analysis is the misinterpretation of results. This can happen because of a lack of understanding of statistical concepts, wrong use of statistical tests, or ignoring the context of the data.
To prevent misinterpretation, analysts should:
- Clearly understand the research question and objectives
- Choose the right statistical methods for analysis
- Think about the limitations and possible biases of the data
- Validate findings through multiple analyses or sensitivity tests
By recognizing and tackling these challenges, researchers and analysts can improve the validity and reliability of their quantitative data analysis. This leads to more informed decision-making.
Software and Tools for Quantitative Analysis
Quantitative data analysis now relies on advanced software and tools. These tools help make complex data analysis easier. They help us understand and see the data clearly.
Excel for Data Analysis
Microsoft Excel is a top choice for data analysis. It has many statistical functions, like regression and hypothesis testing. Excel’s easy-to-use interface makes it great for all levels of analysts.
Statistical Software: SPSS and R
For deeper statistical analysis, SPSS and R are top picks. SPSS is easy to use and has lots of statistical tools. R offers many statistical and graphical methods, thanks to its large community and packages.
Data Visualization Tools: Tableau
Data visualization is key in quantitative analysis. Tools like Tableau have changed this field. Tableau’s simple interface lets users make interactive visualizations. It’s great for understanding data and works well with big datasets.
Choosing the right software or tool depends on your analysis needs. It also depends on the data’s complexity and your expertise. Using these tools well helps analysts find important insights and make better decisions.
Enhancing Decision-Making with Data Insights
Using data to make decisions is changing how businesses plan and operate. Quantitative data analysis helps companies make choices that lead to success.
Utilizing Data for Strategic Planning
Data insights are key in strategic planning. They help businesses spot trends, predict outcomes, and tweak their plans. The steps include:
- Looking at past data to find patterns and trends
- Forecasting the future with predictive analytics
- Changing strategies based on what the data shows
By focusing on data in planning, companies can avoid bad decisions and stay ahead in the market.
Making Evidence-Based Decisions
Evidence-based decision-making is central to today’s business. It means using data to back up choices, not just guesses or stories. The advantages are:
- More accurate decisions
- Better operational efficiency
- Clearer ways to see how decisions affect things
By choosing evidence-based decisions, companies can keep getting better and reach their goals more effectively.
In summary, adding data insights to decision-making is changing how businesses work and plan. As they keep using quantitative data analysis, they’ll be ready to reach their goals and thrive in a tough market.
Ethical Considerations in Quantitative Analysis
In the world of quantitative data analysis, ethical considerations are key. They help keep data safe and private. As we make decisions based on data, we must use it wisely.
Data Privacy and Consent
Data privacy is a big deal in quantitative data analysis. Keeping personal info safe is both a law and a moral duty. It’s important to get clear consent from people whose data we use.
Researchers and analysts must be open about how they’ll use data. They also need to keep it safe. This means following strict data protection rules and laws like GDPR.
Ethical Reporting of Results
Another key part is ethical reporting of results. We must share our findings honestly and without bias. Faking data or twisting results can harm trust in our work.
To stay ethical, analysts should be honest about their methods. They should also talk about any limits or biases in their work. This way, our insights are not just useful but also reliable and trustworthy.
The Future of Quantitative Data Analysis
The world of quantitative data analysis is on the verge of a big change. This change comes from new analytical techniques and artificial intelligence. These advancements will greatly affect how we analyze and understand data.
Trends in Analytical Techniques
New trends are shaping the way we analyze data. The use of machine learning algorithms and predictive analytics is on the rise. These tools help us find complex patterns in data that were hard to spot before.
- Enhanced data processing capabilities
- Improved model accuracy
- Increased efficiency in data analysis
Also, big data is being used more in analysis. This lets us study on a bigger scale, giving us deeper insights.
The Role of Artificial Intelligence
Artificial intelligence (AI) is becoming key in data analysis. AI tools like deep learning and natural language processing help automate tasks. They also help find patterns and create predictive models.
- Automation of routine data tasks
- Enhanced pattern recognition
- Advanced predictive modeling
The mix of AI and data analysis is set to bring big changes. It will help in many areas, from business and healthcare to social sciences and education.
Looking ahead, the future of data analysis is bright. The blend of advanced techniques and AI will keep changing the game. It will lead to better decisions and innovation in many fields.
Learning and Resources for Quantitative Analysis
The field of quantitative data analysis is vast. Finding the right resources is key to mastering it. As more companies need data insights, the demand for skilled analysts grows.
There are many resources to learn from, including books, online courses, and certifications. These options suit different learning styles and skill levels. So, there’s something for everyone.
Recommended Literature
For those who like learning from books, several titles are highly recommended. “Statistics for Business and Economics” by Paul Newbold, William L. Carlson, and Betty Thorne is a top choice. It offers clear explanations and practical examples.
“Data Analysis with R” by Tony Fagan is another great resource. It focuses on using R programming for data analysis, giving you hands-on experience.
| Book Title | Author | Focus Area |
|---|---|---|
| Statistics for Business and Economics | Paul Newbold, William L. Carlson, Betty Thorne | Statistical Analysis in Business and Economics |
| Data Analysis with R | Tony Fagan | R Programming for Data Analysis |
Online Courses and Certifications
Online courses are flexible and easy to access. They’re a great choice for many learners. Platforms like Coursera, edX, and Udemy offer a wide range of courses on quantitative data analysis.
“Data Science Specialization” by Johns Hopkins University on Coursera is very popular. It covers a wide range of data science topics, including quantitative analysis.
- Coursera: Data Science Specialization by Johns Hopkins University
- edX: Data Analysis and Interpretation by Microsoft
- Udemy: Quantitative Data Analysis with Excel
Certifications can boost your credentials, showing your expertise to employers. The Certified Data Analyst credential from Data Science Council of America (DASCA) is highly respected in the field.
Conclusion: The Value of Quantitative Data Analysis
Quantitative data analysis is key in today’s business world. It helps companies make smart, data-backed choices that lead to growth and success. By using statistical methods and data visualization tools, businesses can find important insights, spot trends, and improve their plans.
Driving Business Success
The power of quantitative data analysis comes from its ability to offer insights that lead to action. As the business world gets more complex and competitive, the need for data-driven decisions will grow. By using quantitative data analysis, companies can stay ahead and reach their goals.
In the end, quantitative data analysis is all about helping businesses make smart choices. It drives growth and success in a changing world.